CEFA is a specialized investment firm with the experience, process, resources and credibility to handle your investment portfolio.
Experience
Closed-End Fund Advisors ("CEFA") is active in the Closed-End Fund Association, The CFA Institute and the Richmond Association for Business Economics. CEFA provides a weekly closed-end fund data service.
Process

Resources
Having access to financial research, data and professional contacts, CEFA is on the leading edge of industry developments.
CEFA's Closed-End Fund Universe report offers a comprehensive weekly data report covering the complete list of 500+ available closed-end funds with 250+ data points tracked on 46 unique subgroups.
Credibility
Principals of CEFA are regularly contacted by the financial press for input and commentary on global investments and closed-end fund issues. We also have access to the majority of closed-end fund portfolio management teams in order to stay in touch with changes in their investment outlook.
Accountability
As discretionary, fee-based investment managers, CEFA tracks client performance for its portfolio models as well as comparable indices to measure our absolute and relative performance.
Portfolio Monitoring
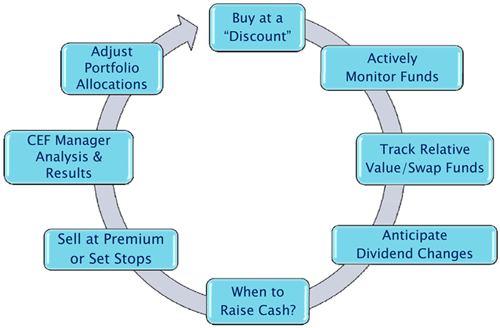
All portfolios are rebalanced regularly and are monitored almost daily in order to ensure that asset allocations stay within set percentages and that each position is the best choice for the underlying investment objective on relative and historical bases. We are active managers making changes to our portfolio models weekly as needed.
Individual Attention
With the benefits of separately managed accounts, CEFA can work on behalf of both individual and institutional investors (with account variances up to 5%) of a portfolio model, as well as monitor tax-sensitivity.
Vested Interest
We are passionate about our work, offering clients the same investment strategies that we use in our own portfolios. Client interests are ALWAYS favored over our own.
As an investor with our firm, there are no front-end or back-end fees. The first quarterly fee is always prorated for only the time we actively work on a portfolio. All of our custodians allow on-line access to clients in order that they may view their portfolios as frequently as they desire. CEFA is one of the few investment firms that publishes their model portfolio performances monthly.
CEF Advisors' Model Portfolio Offerings
We currently offer 16 portfolio composites:
- International Opportunities
- Diversified Equity
- Diversified Growth
- Hybrid (High) Income
- Discount Opportunity
- Alternative Income
- Foundation/Balanced
- Taxable Bond and BDC
- Dividend Confidence Model
- Diversified Low Beta
- Low Correlation
- Diversified Tax-Sensitive Income
- Business Development Company Select
- Municipal Bond Select
- CEFA Select "Six Pack" Income
- CEFA Non-Profit Foundation Diversified Income
Interested? Contact us today for more information and our brochure!
For more information, download our firm's profile presentation and our ADV Part 2.
As of June 30, 2024
| Investment Portfolio Model | QTD | YTD | 1 Year | 3 Year | 5 Year | 10 Year | Since Inception | Inception Date |
|---|---|---|---|---|---|---|---|---|
| Diversified Fixed Income | 4.07% | 9.25% | 17.16% | -0.71% | N/A | N/A | 2.23% | 2/1/2021 |
| Diversified Tax-Sensitive Income | 3.21% | 9.69% | 19.42% | 2.66% | N/A | N/A | 13.59% | 11/1/2020 |
| Non-Profit Diversified Income | 3.07% | 9.17% | 19.65% | N/A | N/A | N/A | 6.50% | 3/1/2022 |
| Alternative Income | 4.14% | 10.00% | 18.49% | 5.41% | 5.47% | N/A | 5.88% | 7/1/2018 |
| Alternative Income Tax Advantaged | 3.66% | 10.12% | 18.43% | 4.66% | 6.55% | N/A | 7.56% | 11/1/2018 |
| Foundation/Balanced | 2.90% | 10.22% | 18.83% | 4.11% | 6.61% | 4.96% | 6.73% | 9/1/2009 |
| Foundation/Balanced Tax-Advantage | 2.88% | 7.26% | 10.39% | -0.49% | 3.49% | N/A | 5.71% | 1/1/2017 |
| Hybrid Income | 4.70% | 12.00% | 22.01% | 6.21% | 7.28% | 5.70% | 6.01% | 12/1/2006 |
| Hybrid Income Tax Advantaged | 4.39% | 11.58% | 21.23% | 4.69% | N/A | N/A | 7.51% | 3/1/2020 |
| Conservative Diversified | 5.53% | 11.19% | 17.07% | 2.30% | 3.76% | 3.27% | 5.08% | 5/1/2009 |
| Diversified Low Beta | 3.52% | 9.42% | 19.67% | 5.96% | 6.97% | N/A | 6.37% | 4/1/2017 |
| Global Growth & Income | 3.89% | 10.04% | 17.36% | 3.24% | 5.22% | 3.07% | 4.21% | 1/1/1999 |
| Globally Diversified Growth | 3.46% | 9.52% | 16.33% | 2.71% | 5.97% | 5.13% | 5.89% | 1/1/1999 |
| Diversified Equity | 2.74% | 8.78% | 13.60% | 3.60% | 6.79% | N/A | 5.41% | 2/1/2018 |
| Business Development Companies | 4.02% | 7.26% | 24.46% | N/A | N/A | N/A | 14.76% | 5/1/2022 |
| Benchmarks | QTD | YTD | 1 Year | 3 Year | 5 Year | 10 Year | Since Inception | Inception Date |
| CEF Advisors 15 Major CEF Sectors (MKT) | 2.63% | 11.10% | 18.97% | 2.23% | 6.92% | 6.01% | 7.86% | 12/30/2011 |
| S&P 500 Total Return |
4.28% | 15.29% | 24.56% | 10.01% | 15.04% | 12.86% | 8.01% | 1/1/1999 |
| Barclays Capital Global Aggregate Bond | -1.12% | -3.16% | 0.93% | -5.49% | -2.02% | -0.42% | 2.81% | 1/1/1999 |
| MSCI World (Ex-US) | -0.60% | 4.96% | 11.22% | 2.82% | 6.55% | 4.27% | 4.72% | 1/1/1999 |
| CEF Advisors Taxable Bond & BDC (MKT) | 2.19% | 8.65% | 17.20% | -0.01% | 4.31% | 4.74% | 5.96% | 12/30/2011 |
| CEF Advisors All Sector Equity CEF (MKT) | 2.42% | 10.59% | 16.12% | 2.32% | 8.08% | 6.56% | 8.92% | 12/30/2011 |
| CEF Advisors Debt-Focused BDC (MKT) | 4.53% | 7.49% | 23.28% | 9.58% | 11.24% | 7.38% | 10.03% | 12/30/2011 |
| 60/40 S&P 500/Barclays Bond | 2.12% | 7.91% | 15.11% | 3.81% | 8.22% | 7.55% | 5.93% | 1/31/1999 |
| CEF Advisors 60/40 Balanced (w/ BDCs) | 2.49% | 9.90% | 16.92% | 1.72% | 7.18% | 6.27% | 8.40% | 12/30/2011 |
| CEF Advisors National Municipal Bond | 2.62% | 5.18% | 9.31% | -5.66% | 0.41% | 3.24% | 3.44% | 12/30/2011 |
| Globally Diversified Growth | $4,286,124 |
| S&P 500 Total Return | $7,095,667 |
| Barclays Capital Global Agg Bond Total Return | $2,023,303 |
| 60/40 S&P 500/Barclays Bond | $4,327,488 |
Interested? Contact us today for more information and our brochure!

